Select Language
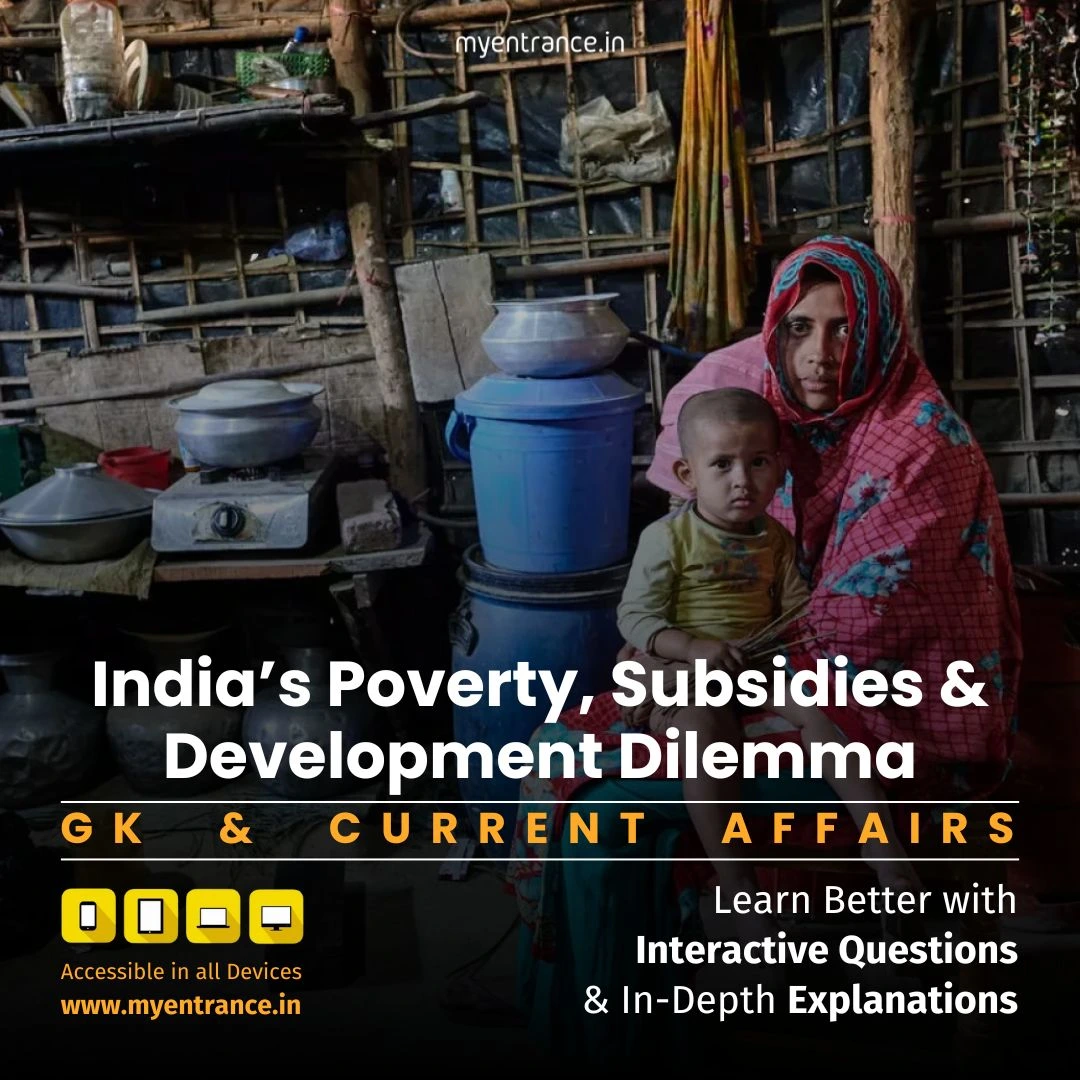
Poverty Alleviation & Subsidy Reforms: India’s Inclusive Growth Challenge: Exam Guide
As India transitions from a $2T to $4T economy, its growth story faces critical inclusivity tests. This analysis unpacks poverty metrics, subsidy efficacy, and sustainable pathways for equitable development—vital for UPSC GS I, II, and III.
Understanding Poverty: Definitions & Frameworks
Poverty isn’t just income deprivation—it’s multidimensional (health, education, living standards). International bodies define it differently:
World Bank: $2.15/day (extreme poverty, 2017 PPP).
UN: Multidimensional Poverty Index (MPI).
India’s Committees:
Alagh (1979): Calorie-based (2,400 kcal rural, 2,100 kcal urban).
Tendulkar (2009): Shifted to consumption expenditure (₹816/month rural, ₹1,000/month urban, 2011).
Rangarajan (2012): Higher thresholds (₹972 rural, ₹1,407 urban).
Subsidy Rationalisation: A Fiscal Imperative
With poverty rates near 4.5%, large-scale subsidies strain resources:
Food Subsidy (FY26: ₹2.03L cr): Covers 800M+ via NFSA. Solution: Replace free grains with digital food coupons (₹500–₹700/month) for nutritious diets (pulses, eggs).
Fertiliser Subsidy: Promotes NPK imbalance (current ratio 31:15:1 vs. ideal 4:2:1). Reforms:
PM-PRANAM: Incentivise states to reduce chemical fertilisers.
One Nation One Fertiliser: Standardise brands to cut misuse.
Growth vs. Inclusion: The Inequality Paradox
India’s macro success is undeniable:
GDP Growth: $2.04T (2014) → $4.19T (2025).
PPP Per Capita: $4,935 (2014) → $12,131 (2025).
Yet, Gini coefficient stagnates (32.8 in 2022), exposing gaps:
“Despite rising to 3rd largest economy (PPP), India ranks lowest in G20 per capita income ($2,878).”
The Way Forward: Inclusive Policy Shifts
Targeted Welfare: Limit NFSA coverage using SECC data; redirect savings to health/education.
Fertiliser Deregulation: Let farmers use subsidies for bio-fertilisers/natural farming.
Tenant Farmer Integration: Formalise landless cultivators via digitised records.
Growth Redistribution: Boost MGNREGA wages and skill development.
Sample Q&A (UPSC-Focused)
Q: How did the Tendulkar Committee redefine poverty estimation in India?
A: Moved from calorie intake to monthly consumption expenditure (₹816 rural/₹1,000 urban, 2011), incorporating health and education costs.
Q: Why does India need fertiliser subsidy reforms despite PM-PRANAM?
A: NPK imbalance (31:15:1) harms soil health; deregulation can promote bio-fertilisers and correct ecological inefficiencies.
Q: Critically examine the role of NFSA in reducing hunger amid declining poverty rates.
A: NFSA ensured food security but now suffers from leakages and dietary monotony. Digital coupons could improve nutrition and reduce fiscal burden.
Q: What does India’s low G20 per capita GDP ($2,878) reveal about its growth model?
A: Highlights persistent inequality despite macro growth, necessitating redistributive policies like universal basic services.
Q: Discuss how Rangarajan Committee’s poverty line differed from Tendulkar’s.
A: Rangarajan set higher thresholds (₹972 rural/₹1,407 urban) and included additional non-food essentials like housing and sanitation.
Most Predicted Questions
Comprehensive study materials, Expert-guided tips & tricks, Mock tests and instant results.
Start your SSC, NIFT, NID, FDDI, PSC journey today with MyEntrance, your ultimate online coaching platform.
Read More Topics