Translate Language
Why Did 8 of India’s Top Power States See Electricity Use Drop This Summer?
India’s power consumption dipped unexpectedly in Q1 of FY 2025-26, with 8 major states recording year-on-year declines. Erratic rainfall in May and a high baseline from last year’s surge are key culprits. This trend offers critical insights into climate-economy linkages for competitive exams.
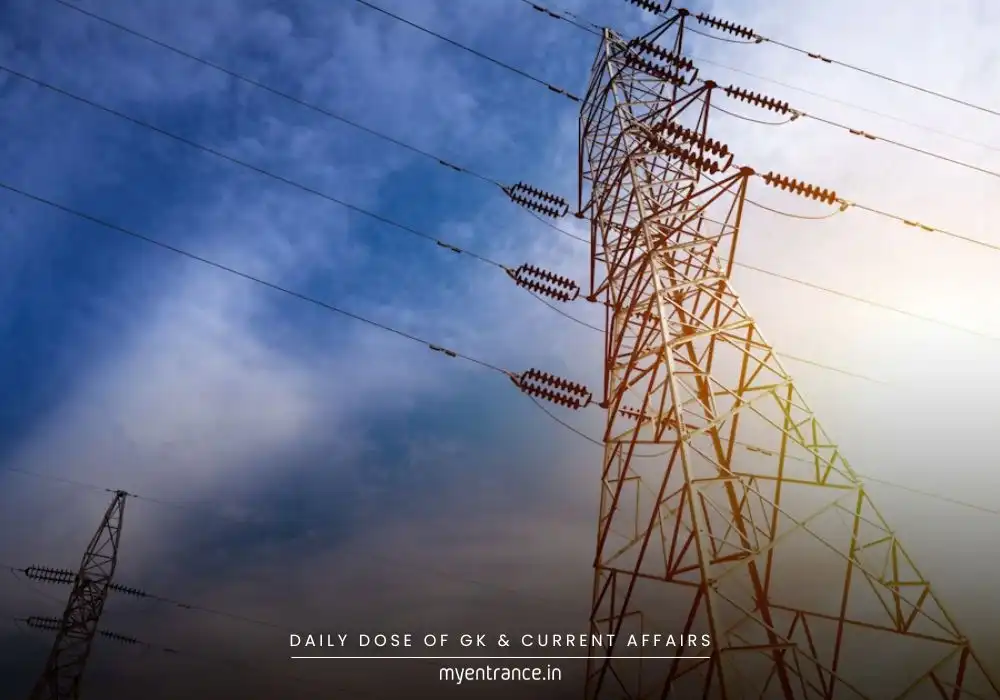
India’s electricity landscape witnessed an unusual slowdown this summer. Between April and June 2025, 8 out of the nation’s top 10 power-consuming states saw a drop in electricity usage compared to last year. The dual forces of unpredictable rainfall and the “high base drag” effect (where record-high previous-year numbers make current growth harder to achieve) are primarily to blame.
Here’s what the data reveals:
National consumption fell by 1.4% (451.8 billion units vs. last year).
Maharashtra (India’s largest consumer) dipped marginally, while Uttar Pradesh saw a sharp 5.6% fall.
Only Punjab (+2.2%) and Gujarat (+0.4%) bucked the trend.
Southern states like Tamil Nadu (-3%), Karnataka (-2.9%), and Andhra Pradesh (-0.2%) mirrored the decline.
Why did this happen?
May’s unseasonal rains in North India slashed cooling demand, causing a 4.7% YoY consumption drop that month.
Early monsoon arrival (June 29 vs. usual July 8) further suppressed June demand by 1.8%.
Last year’s surge (UP +24%, Rajasthan +21% in Q1 FY25) created a tough benchmark.
Despite this dip, India’s power sector shows strong long-term resilience:
A 7% CAGR growth since Q1 FY22.
UP, West Bengal, and Rajasthan lead 5-year growth at over 8% annually.
Renewable energy now forms 49% (235.7 GW) of India’s 476 GW capacity – a key stride toward its 500 GW non-fossil target by 2030.
Q&A for Exam Aspirants:
Q1: Which two states defied India’s declining power consumption trend in April-June 2025?
A1: Punjab (+2.2%) and Gujarat (+0.4%).
Q2: Define the “high base drag” effect in power demand analysis.
A2: It refers to suppressed growth rates in the current period caused by exceptionally high consumption levels in the same period of the previous year.
Q3: How did unseasonal rainfall impact India’s power demand in May 2025?
A3: It caused a 4.7% year-on-year decline due to reduced cooling needs across North India.
Q4: What percentage of India’s total installed capacity comes from non-fossil sources as of June 2025?
A4: 49% (235.7 GW out of 476 GW total capacity).
Q5: Why is the dip in hydropower generation (16.3% in FY24) significant for India’s energy planning?
A5: It highlights vulnerability to climate variability and underscores the need for diversified energy mix and better water management strategies.
Why This Matters for Exams:
This topic intersects UPSC/PSC/SSC syllabi in 3 key areas:
Economy (GS III): Resource mobilization, growth trends, and infrastructure resilience.
Environment (GS III): Climate-energy nexus, renewable targets, and monsoon impacts.
Current Affairs: Data interpretation of national indicators (power demand = economic health proxy).
Understanding these linkages helps tackle mains questions on sustainable development, grid management, and climate adaptation policies – frequent themes in IAS, KAS, and state PSCs.
Get 3 Months Free Access for SSC, PSC, NIFT & NID
Boost your exam prep!
Use offer code WELCOME28 to get 3 months free subscription. Start preparing today!


