Translate Language
Kaziranga’s Tiger Boom: 103 Days, 4,011 Images & What It Means for Exams
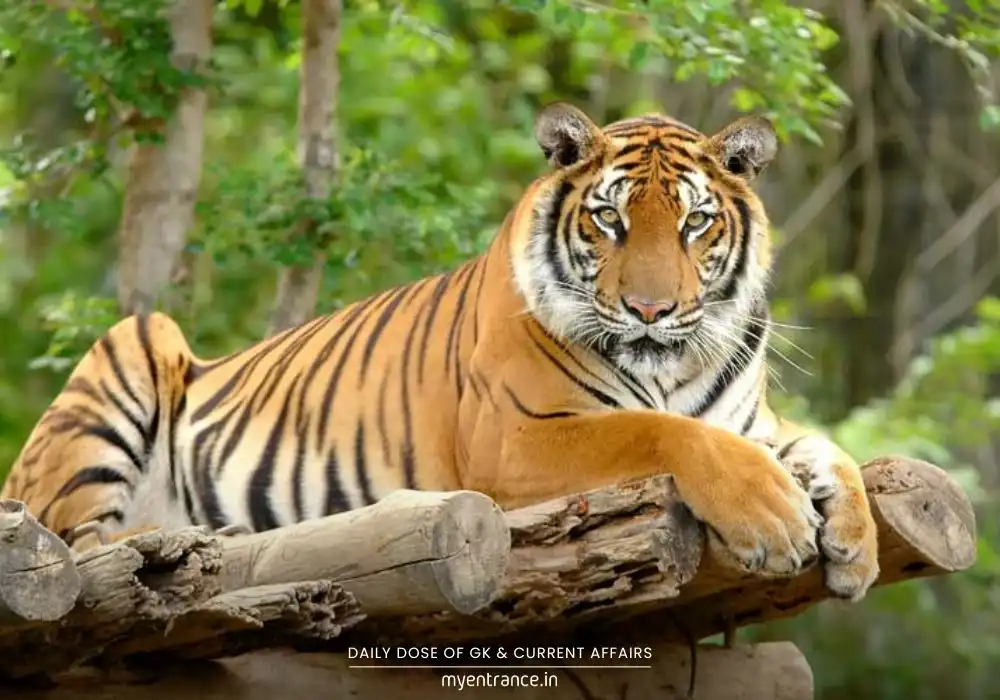
Kaziranga Tiger Reserve just revealed a landmark feat: 18.65 tigers per 100 sq. km, making it the world’s third-highest tiger density. This first large-scale census used cutting-edge tech to count 148 tigers – a 42% surge since 2022. For competitive exams, this case study is a goldmine for ecology and conservation topics.
How Kaziranga Counted Its Tigers
Let’s break down the science step-by-step, as I’d explain to my classroom:
1. The Camera Trap Grid:
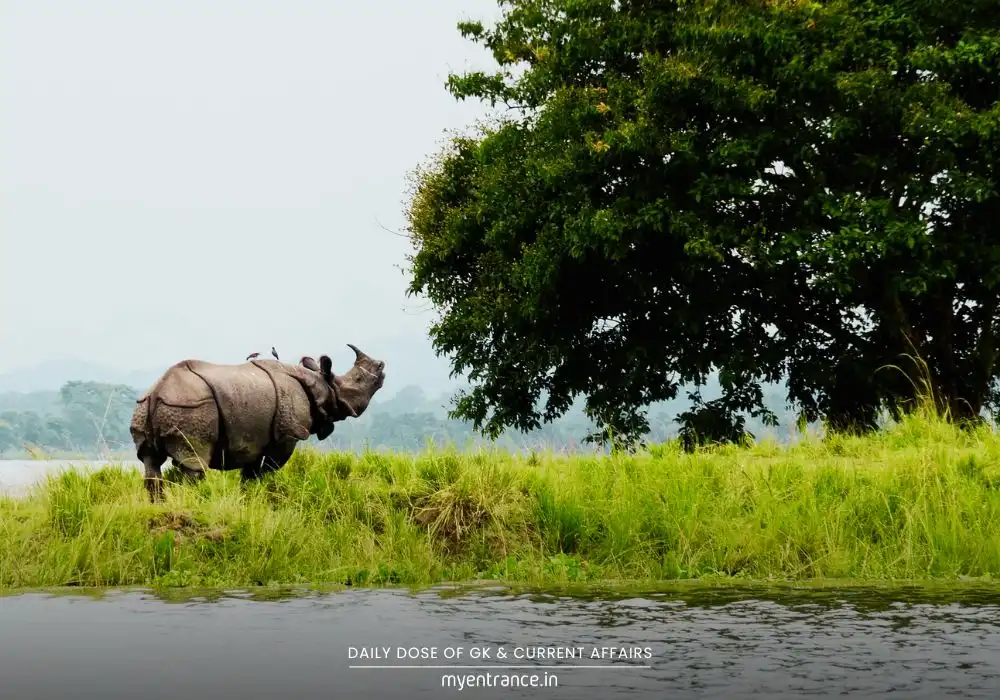
293 paired cameras were strategically placed across 1,307 sq. km of Kaziranga’s grasslands, forests, and wetlands.
These motion-sensitive devices snapped 4,011 tiger images over 103 days, day and night.
2. The ‘Fingerprint’ Technique:
Every tiger has unique stripe patterns on its flanks – like a barcode.
Researchers analyzed each image to identify individuals (83 females, 55 males, 10 unknown). No double-counting!
3. Advanced Statistical Modeling:
Data was processed using spatial capture-recapture (SCR). This model calculates tiger density by tracking how often the same tiger appears in different camera locations.
NTCA’s MSTrIPES software integrated field data with GPS mapping for accuracy.
4. Why the Numbers Soared:
The inclusion of Biswanath Wildlife Division (27 new tigers) expanded the survey zone.
Anti-poaching drives and habitat restoration boosted survival rates.
Why This Matters for SSC/UPSC/PSC Exams
This case study is directly relevant to your syllabus:
Prelims: Covers “Environmental Ecology & Biodiversity” (tiger census methods, NTCA’s role).
Mains GS-III: Illustrates “Conservation Strategies” (habitat management, human-wildlife conflict).
Key Themes:
Role of NTCA (statutory body under MoEF&CC).
Conservation Tools: MSTrIPES, CATS accreditation, Management Effectiveness Evaluation (MEE).
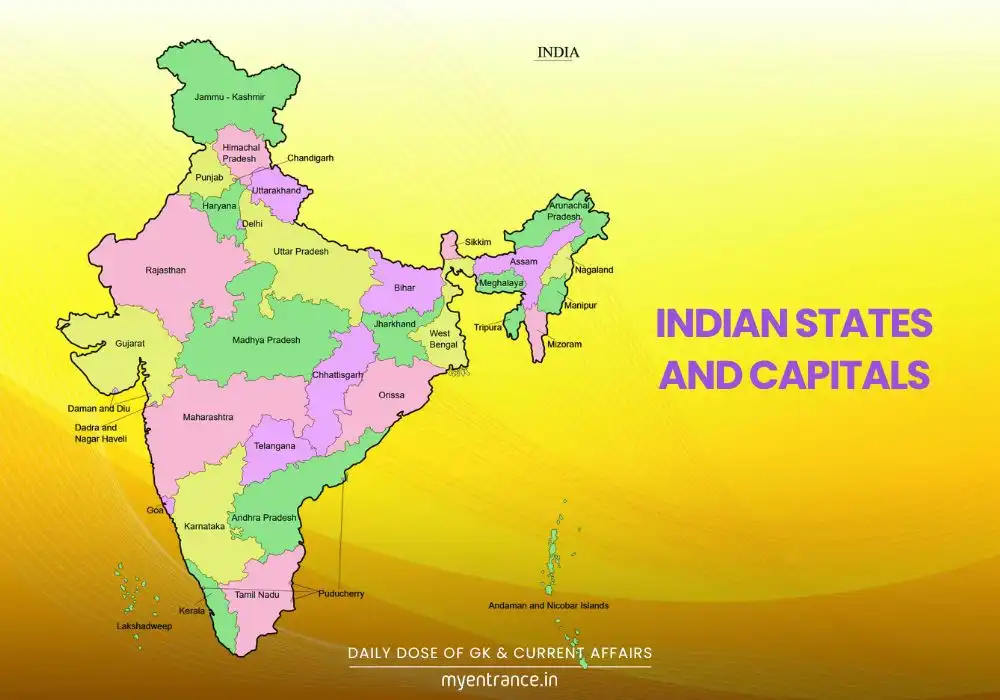
Map-Based Qs: Kaziranga (Assam), Top tiger states (MP>Karnataka>Uttarakhand).
Current Link: Shows how tech (camera traps/SCR) solves ecological challenges – a hot trend in questions.
Q&A for Exam Prep
Q1: Which agency directed Kaziranga’s 2024 tiger survey?
A: The National Tiger Conservation Authority (NTCA), a statutory body under the Ministry of Environment, Forests & Climate Change.
Q2: How do camera traps prevent double-counting tigers?
A: Each tiger’s flank stripe pattern is unique. By matching stripes across images, researchers identify individuals accurately.
Q3: Kaziranga has the world’s third-highest tiger density. Which reserves rank higher?
A: Corbett Tiger Reserve (Uttarakhand) and Bandipur Tiger Reserve (Karnataka).
Q4: What is spatial capture-recapture (SCR) in tiger monitoring?
A: SCR estimates population density by analyzing how often individual tigers are “recaptured” (photographed) across different camera locations within their movement range.
Q5: Why did Kaziranga’s tiger count increase by 42% since 2022?
*A: Primarily due to the first-time inclusion of Biswanath Wildlife Division (adding 27 tigers) and improved conservation measures like anti-poaching patrols.*
Key Takeaways for Quick Revision
Survey Scale: 103 days, 293 cameras, 1,307 sq. km.
Findings: 148 tigers (↑42% from 2022); 18.65 tigers/100 sq. km (3rd globally).
Drivers: Biswanath inclusion, grassland conservation, NTCA’s Phase-IV monitoring.
Threats: Habitat fragmentation, climate change, infrastructure near reserves.
Tech Used: Camera traps, spatial capture-recapture, MSTrIPES.
Get 3 Months Free Access for SSC, PSC, NIFT & NID
Boost your exam prep!
Use offer code WELCOME28 to get 3 months free subscription. Start preparing today!
Read More Topics