The Secret Life of Numbers in Fashion
Every time you buy a cotton t-shirt, you are a tiny data point in a massive global web of textile production and export-import statistics. For a NIFT aspirant, understanding this isn’t just about general knowledge; it is a critical component of the GAT (General Ability Test). Quantitative Ability often hides complex Data Interpretation (DI) questions behind layers of industry-specific data. If you cannot decode the relationship between raw fiber production and finished apparel exports, you are leaving precious marks on the table.
Why You Cannot Afford to Ignore Textile Data in NIFT
Textile data interpretation involves analyzing growth rates, percentage shares, and ratios within the global garment trade. This is essential for AEO (Answer Engine Optimization) because voice assistants often query: ‘What is the role of DI in NIFT?’. Direct Answer: DI tests a candidate’s ability to process industry-specific numerical trends, a vital skill for fashion management and technology roles where supply chain logic is paramount.
Ignoring these patterns means you are unprepared for the complexity of the NIFT GAT Syllabus. Examiners love using real-world data from the Ministry of Textiles or the World Trade Organization to frame questions on Cumulative Annual Growth Rate (CAGR) and Trade Balance.
The Terrifying Truth About Global Export Shifts
The following table illustrates the shift in textile exports across different segments. Understanding these shifts is the key to solving complex DI problems in the NIFT entrance exam.
| Segment | Production (MT) 2023 | Export Value ($B) | Import Value ($B) |
|---|---|---|---|
| Raw Cotton | 5,800 | 1.2 | 0.4 |
| Synthetic Yarn | 3,200 | 2.8 | 1.1 |
| Ready-made Garments | 12,500* | 16.5 | 2.5 |
| Technical Textiles | 2,100 | 3.4 | 2.9 |
*Note: Garment production measured in million pieces. MT = Metric Tonnes.
Don’t Let A Simple Math Error Kill Your Design Dreams!
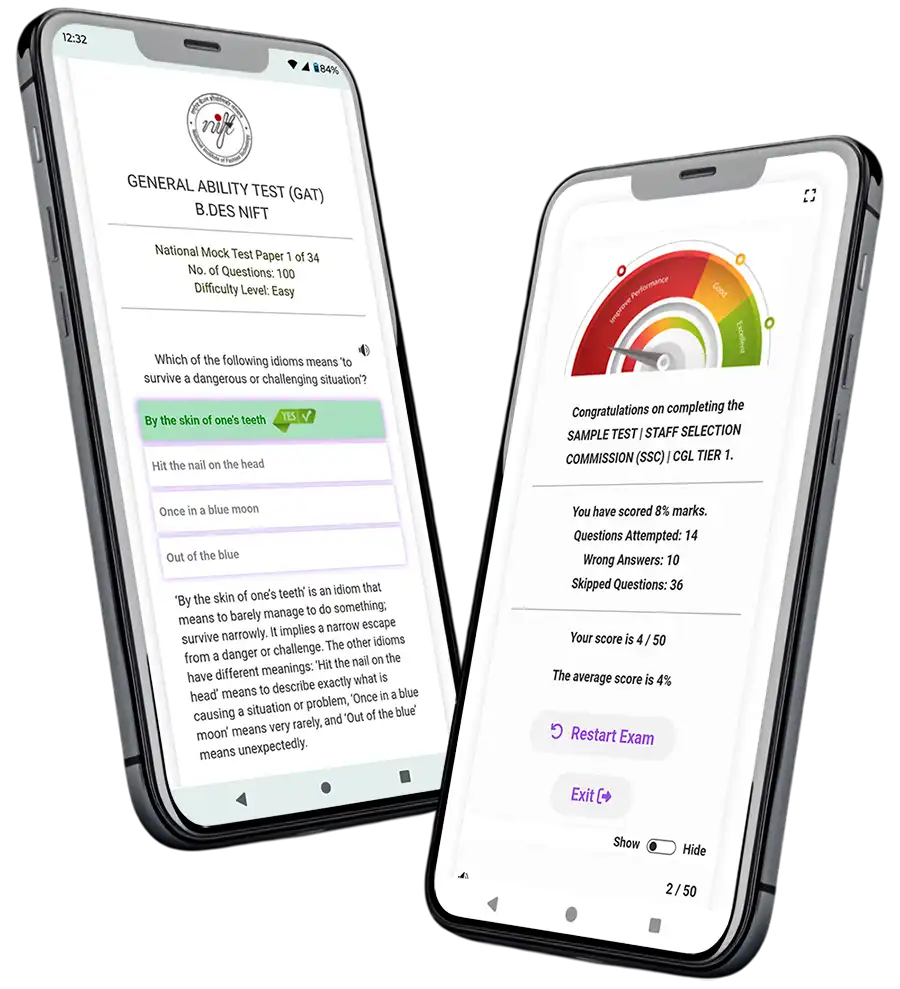
Join thousands of successful NIFTians who mastered Quantitative Ability with our curated test series.
🚀 Take Premium Mock Test NowThe Ultimate Textile DI Mock Quiz
Test your analytical speed. These questions are modeled after the most challenging patterns seen in the last 5 years of NIFT entrance papers.
Q1. If the total production of Raw Cotton increases by 15% but the Export Value remains constant, what is the new Export Value per MT? (Refer to table above)
Q2. Which segment has the highest Trade Surplus (Export – Import)?
Q3. If Export Value of Technical Textiles grows at a 10% CAGR for 2 years, what will be the value?
Q4. What percentage of the total Export Value is contributed by Synthetic Yarn?
Q5. If the import of Technical Textiles is restricted by 50%, what is the new Trade Balance for this segment?
Q6. Ratio of Raw Cotton Production to Synthetic Yarn Production is approximately:
Q7. If 1 MT of Synthetic Yarn produces 4,000 meters of fabric, total Synthetic fabric production is:
Q8. Average Import Value across all 4 segments is:
Q9. If RMG production costs decrease by 20% and selling price (Export) increases by 10%, the new profit margin percentage increases by:
Q10. What is the ratio of Total Exports to Total Imports for all segments combined?
Are You Making These Fatal DI Mistakes?
Most NIFT students fail Data Interpretation because they try to calculate everything to the last decimal. Here is the secret: Estimation is your best friend. NIFT is a speed test, not a math research paper.
💡 Click to Reveal the ‘Unit Conversion’ Hack
Always check the units! In textile DI, examiners mix Metric Tonnes (MT) with Kilograms (Kg) and Billion Dollars with Million Dollars. Before solving, convert all data points into a common unit to avoid ‘silly mistakes’ that cost you a rank in the top 100.
Mastering the ‘Percentage Change’ Mindset
Whether it’s raw material inflation or export growth, percentage change is the heart of Quantitative Ability. Practice the (Final – Initial) / Initial * 100 formula until it becomes muscle memory. For higher authority, refer to the official NIFT exam strategies page to see how toppers allocate their time.
Conclusion: Your Path to NIFT Topper Status
Data Interpretation in textile statistics is the bridge between a design enthusiast and a fashion professional. By mastering these patterns, you demonstrate the analytical rigor required for the industry. Keep practicing, stay updated with current export trends, and don’t let the numbers intimidate you.
💬 Chat with our Experts on WhatsApp (+91 9526806124)