Translate Language
Is India Really the Most Equal Country in the World? The Surprising Truth!
India has been ranked as the most equal country in consumption distribution, according to the World Bank’s Gini Index. However, the same report highlights rising income inequality, creating a puzzling contradiction. What explains this disparity, and how reliable are these measurements? Let’s break it down.
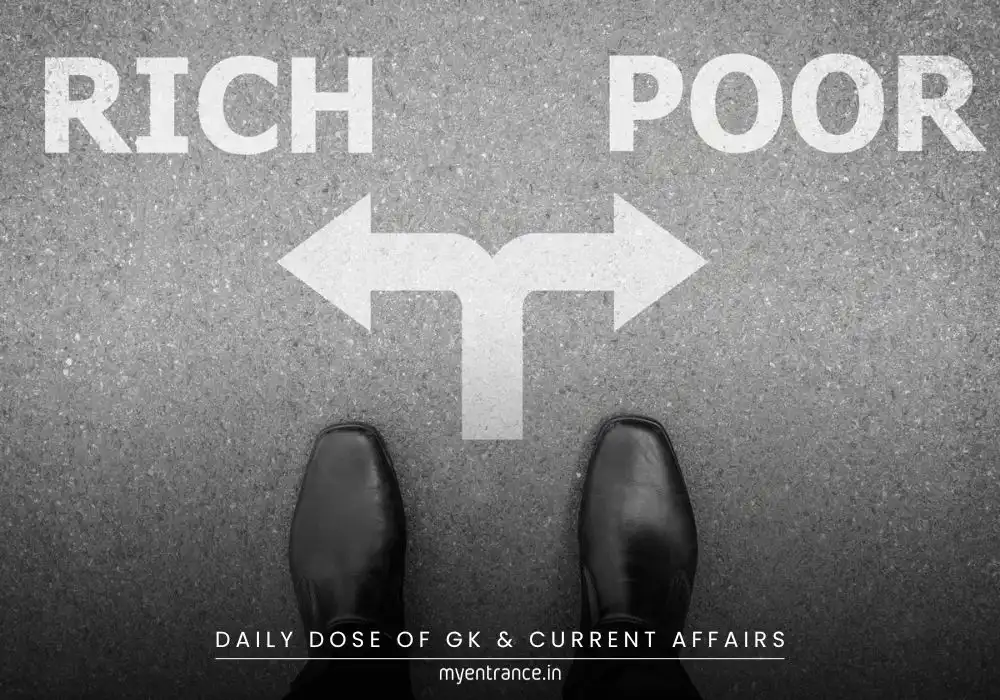
India’s Inequality Paradox: Consumption vs. Income
Key Findings from the World Bank Report
India’s consumption Gini Index (25.5) is the lowest globally, indicating high equality in spending patterns.
However, income inequality remains one of the highest, raising questions about data accuracy.
The World Bank’s Poverty & Inequality Platform (PIP) relies on government surveys, but income data for India is missing, leading to skewed estimates.
Why Is This Debate Important?
Government policies (like subsidies & welfare schemes) may improve consumption equality but fail to bridge income gaps.
Global rankings (like the Gini Index) influence foreign investments and economic perceptions.
Flawed measurements (such as synthetic income estimates) distort reality, as noted by economist Surjit Bhalla.
How Is Inequality Measured?
Gini Index – Measures income/consumption distribution (0 = perfect equality, 100 = extreme inequality).
Palma Ratio – Compares top 10% earners vs. bottom 40%, highlighting wealth concentration.
Household Surveys – The primary tool, but often incomplete (e.g., India lacks official income surveys).
Key Flaws in Global Inequality Reports
No income data for India & South Africa – Estimates are “warped” due to reliance on synthetic models.
Consumption ≠ Income – Welfare schemes may boost spending but not earnings.
Media Misinterpretation – Many outlets confuse consumption equality with overall economic equality.
Sample Q&A for Competitive Exams (UPSC/SSC/PSC)
Q1: What does a low Gini Index indicate?
A: A low Gini Index (closer to 0) suggests high equality in income/consumption distribution.
Q2: Why does India rank high in consumption equality but low in income equality?
A: Welfare schemes (subsidies, free food) boost spending among the poor, but income growth remains unequal.
Q3: What is the Palma Ratio?
A: It compares the top 10%’s income share to the bottom 40%’s, exposing wealth concentration.
Q4: How does the World Bank measure inequality?
A: Through its Poverty & Inequality Platform (PIP), analyzing household surveys from 167 countries.
Q5: What’s the controversy around India’s inequality data?
A: The World Bank lacks India’s income surveys, relying on estimated models, leading to unreliable claims.
Key Takeaways for Exam Preparation
✔ India’s consumption equality is world-leading (Gini 25.5), but income inequality is high.
✔ The Gini Index is widely used but flawed without actual income data.
✔ Fiscal policies (taxes, subsidies) impact inequality but don’t fully reflect ground realities.
✔ Competitive exams (UPSC/SSC) often ask about economic indicators – focus on definitions & critiques.
Get 3 Months Free Access for SSC, PSC, NIFT & NID
Boost your exam prep!
Use offer code WELCOME28 to get 3 months free subscription. Start preparing today!


