Select Language
India’s Poverty Revolution: Decoding World Bank’s $3 Poverty Line
Ace your entrance exams with this complete guide to the World Bank’s poverty line revision—a hot topic in current affairs! At MyEntrance, we make online preparation easy, ensuring you’re ready for GK sections on NID, NIFT, SSC, PSC, and more.
Why This Is Making Headlines
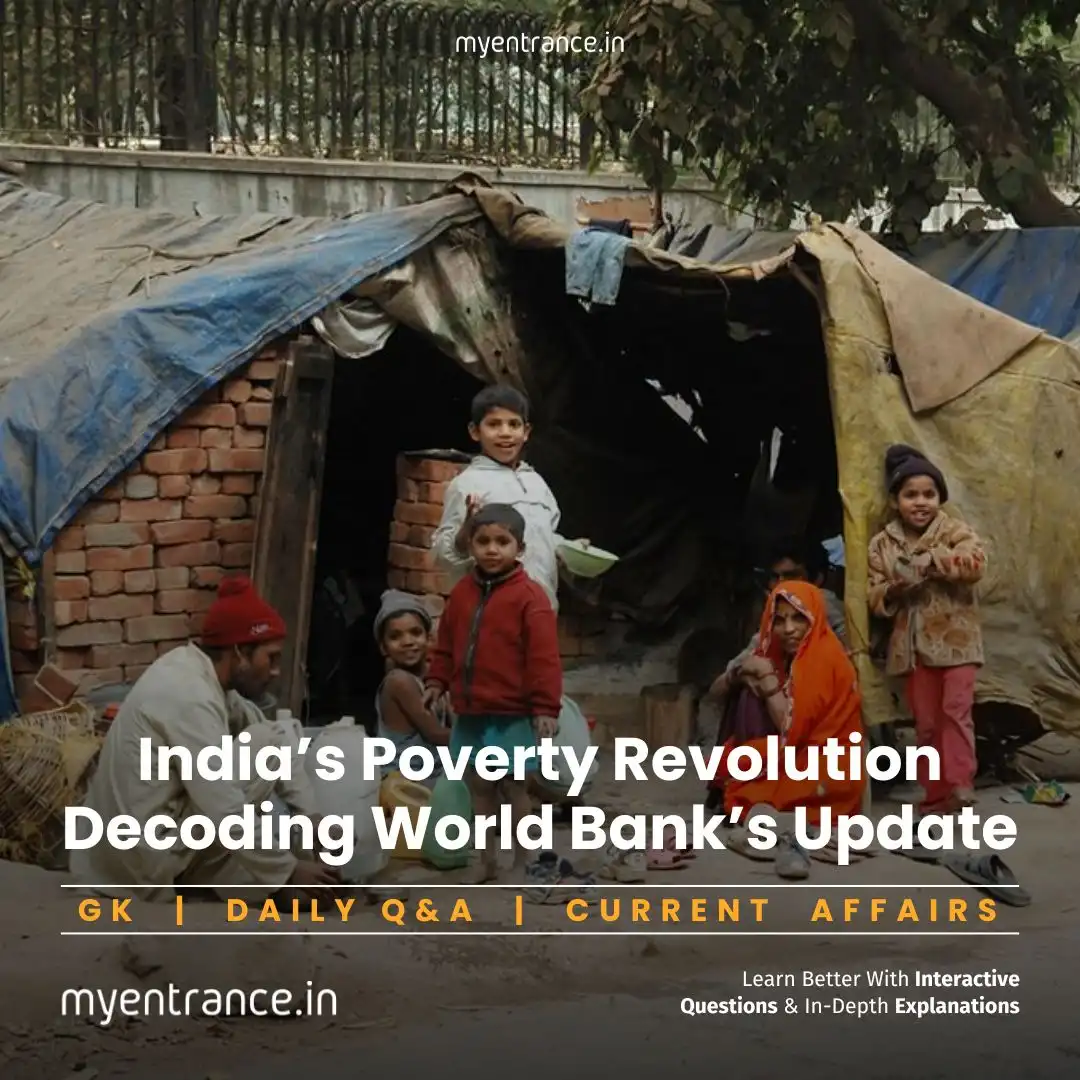
The World Bank recently reset its global poverty benchmark to $3/day (up from $2.15). For India, this change paints a dramatic picture: extreme poverty rates plummeted from 27.1% in 2011–12 to just 5.3% in 2022–23. In real numbers, that’s a drop from 344 million to 75 million people. But what does “poverty line” really mean? Simply put, it’s the minimum income needed to afford basic essentials—a threshold that varies by country and evolves over time.
India’s Poverty Journey: Key Milestones
Historical Leadership: India pioneered poverty estimation methods that influenced global standards.
Controversial Benchmarks: The last official poverty line (2011–12) used the Tendulkar Committee’s formula: ₹30/day (rural) and ₹36/day (urban). Earlier, it was just ₹12 (rural) and ₹17 (urban).
Unresolved Updates: A 2014 Rangarajan Committee recommended raising the line to ₹33 (rural) and ₹47 (urban), but it was never adopted. Today, India relies on World Bank data or NITI Aayog’s Multidimensional Poverty Index (MPI).
Global vs. National Poverty Metrics
The World Bank’s “$1/day” poverty line debuted in 1990, adjusting for inflation over decades. Its June 2024 update to $3/day reflects rising living costs worldwide. For India, even under this stricter threshold:
Poverty fell sharply to 5.3% (vs. 2.3% under the old $2.15 line).
Those below the $4.20/day “lower-middle income” line dropped from 58% to 24% (732 million to 342 million).
The Multidimensional Poverty Index (MPI): A New Lens
Unlike income-based measures, the MPI—used by the UN and NITI Aayog—tracks broader deprivations in health, education, and living standards. Key facts:
Global MPI (2024): India has the world’s highest poor population (234 million), despite a “medium” Human Development Index.
India’s National MPI: Tracks 12 indicators across health, education, and living conditions. States like Bihar and Jharkhand show the highest deprivation.
Why This Matters for Your Exams
Questions on poverty lines, MPI, and economic surveys frequently appear in:
GK sections of NID, NIFT, UCEED, and FDDI exams.
UPSC/state PSCs (e.g., 2015 mains asked about urban/rural poverty estimates).
Understanding these concepts demonstrates analytical skills—critical for design exams testing societal awareness.
Sample Questions & Answers:
Q: What is the World Bank’s revised international poverty line?
A: $3 per day (up from $2.15).
Q: Which committee proposed India’s last official poverty line in 2011–12?
A: The Tendulkar Committee.
Q: How does MPI differ from income-based poverty metrics?
A: MPI measures deprivations in health, education, and living standards—not just income.
Q: What was India’s extreme poverty rate in 2022–23 under the $3/day line?
A: 5.3% (down from 27.1% in 2011–12).
Q: Which Indian body collaborates with UNDP on the National MPI?
A: NITI Aayog.
Most Predicted Questions
Comprehensive study materials, Expert-guided tips & tricks, Mock tests and instant results.
Start your SSC, NIFT, NID, FDDI, PSC journey today with MyEntrance, your ultimate online coaching platform.

