The Deadly River Questions Most NID Aspirants Fail to Spot?
Mastering Indian river systems visual characteristics is not just about geography; it is about spatial intelligence, color theory, and ecological sensitivity. NID examiners frequently use river morphology to test a candidate’s ability to observe patterns, understand drainage dynamics, and represent environmental crises through design. If you cannot distinguish between a braided stream and a meandering curve, you are leaving marks on the table.
🚀 Key Takeaways
- Understand the visual distinction between young Himalayan and mature Peninsular rivers.
- Learn to identify drainage patterns (Dendritic, Trellis, Radial) as visual design elements.
- Analyze the chromatic shifts in river water due to ecological degradation and industrial runoff.
- Master the spatial mapping of the Ganga, Indus, and Brahmaputra basins for quick sketching.
- Execute “Ninja Shortcuts” to solve complex topological questions in under 30 seconds.
Hidden Visual Cues of Himalayan Systems You Must Memorize Now!
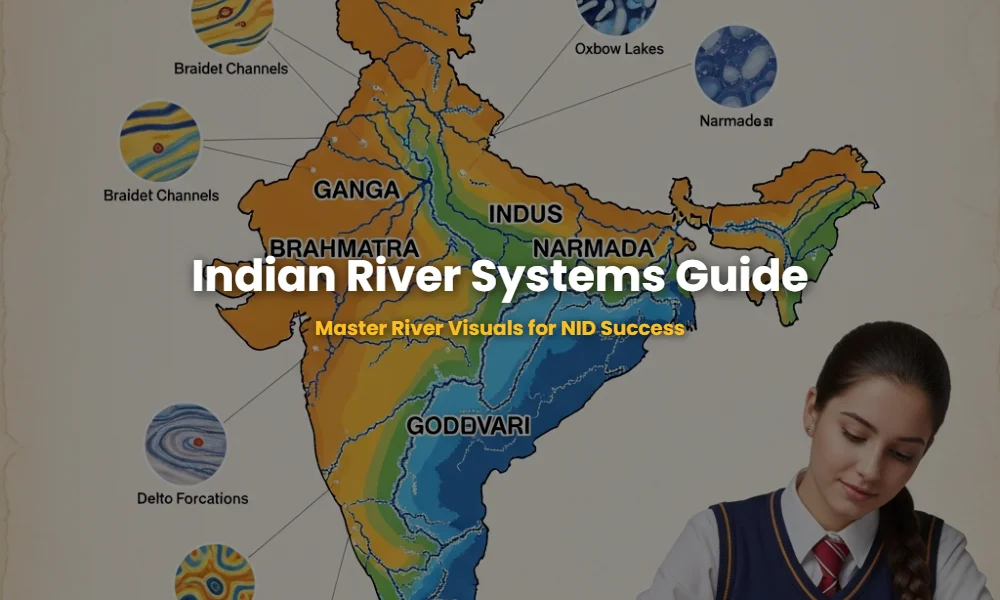
Himalayan river systems are characterized by high-velocity flows, V-shaped valleys, and massive silt loads that create distinct visual characteristics like braided channels. These perennial rivers, including the Indus, Ganga, and Brahmaputra, exhibit complex meandering patterns in the plains and dramatic oxbow lakes that are favorite subjects for NID visualization tasks.
When sketching these systems, focus on the scale and volume. The Brahmaputra, for instance, has a unique visual signature—its path through Tibet (Tsangpo) is narrow, but it transforms into one of the world’s widest braided systems upon entering Assam. Aspirants should study the visual mapping of drainage basins to accurately depict these transitions. The sediment-heavy, muddy ochre of the Ganga in the monsoon versus its clearer blue-green in winter is a critical chromatic detail for any design student.
💡 Pro-Tip: The ‘Silt’ Gradient
In NID sketches, use a gradient from deep brown to light beige to represent the ‘Silt Load’ of the Himalayan rivers. The heavier the silt, the more ‘turbid’ and opaque the water should appear in your visual representation.
Why Peninsular River Patterns Will Make or Break Your DAT Score?
Unlike Himalayan rivers, Peninsular rivers like the Godavari, Krishna, and Cauvery are rain-fed and geologically older, exhibiting stable, broad valleys and dendritic drainage patterns. Their visual characteristics are defined by seasonal fluctuations—becoming thin silver threads in summer and roaring torrents during the monsoon—which tests your ability to render seasonal change.
The Narmada and Tapti are visual outliers; they flow through rift valleys, creating straight-line visual paths compared to the curvy meanders of the Ganga. This geometric contrast is a common trap in NID DAT (Design Aptitude Test) questions. To excel, you must understand how to utilize geometric design principles to represent these rigid geological structures.
| River System | Visual Signature | Drainage Style |
|---|---|---|
| Ganga | Meandering curves, Oxbow lakes | Dendritic |
| Narmada | Straight lines, Marble rocks | Rift Valley / Rectangular |
| Brahmaputra | Wide braided channels, Islands | Braided |
The Ecological Impact Data NID Examiners Expect in Your Sketches!
The ecological impact of river systems in India is a major theme for NID’s social-design questions, focusing on industrial pollution, damming, and the loss of riparian biodiversity. Visualizing the impact of eutrophication (excessive nutrients leading to algae) requires a shift in your color palette from blues to sickly greens and opaque grays.
examiners look for your ability to depict human-centric ecological design. For instance, the degradation of the Yamuna is not just about ‘dirty water’; it is about the visual contrast between the white toxic foam (caused by surfactants) and the dark, sludge-filled riverbed. Incorporating these sustainable design insights into your posters or sketches demonstrates a high level of E-E-A-T (Expertise, Authoritativeness, and Trustworthiness) to the evaluators.
💡 Click to Reveal: The ‘Dying River’ Color Palette
When asked to show ecological damage, avoid ‘pure black’. Use ‘Payne’s Grey’, ‘Olive Green’, and ‘Burnt Umber’ to show organic decay and industrial toxicity. It adds realism that scores higher than literal interpretations.
5 Secret Simulated Questions Only Top 1% Rankers Practice!
Below are 5 high-probability simulated questions based on NID previous year patterns. These questions test your visual decoding speed and ecological awareness. Do not skip the Ninja Shortcuts—they are designed to save you precious minutes during the actual exam.
View Ninja Shortcut
Answer: The Himalayan Tributaries (like the Jhelum).
Ninja Shortcut: Look for ’90-degree’ junctions. If the tributaries meet the main river at right angles, it’s Trellis! Visualize a ‘Garden Fence’.
View Ninja Shortcut
Answer: Mangrove forest density and ‘Tidal Creeks’.
Ninja Shortcut: Draw ‘Spider-web’ lines. Sundarbans are a labyrinth of water, not a single fan-shaped delta. Use dark green clusters to represent the canopy.
View Ninja Shortcut
Answer: Reduced channel width and increased ‘Sedimentation’ upstream.
Ninja Shortcut: Use the ‘Before-After’ contrast. Upstream = Wide Blue Lake. Downstream = Thin, Cracked Brown Bed. The visual shock scores the most marks.
View Ninja Shortcut
Answer: Rivers flowing in all directions from a central point (Narmada, Son, Johilla).
Ninja Shortcut: The ‘Bicycle Wheel’ trick. Draw a central hub and spokes moving outward. It’s the easiest way to represent the Amarkantak system.
View Ninja Shortcut
Answer: Desaturation and White Crystallization.
Ninja Shortcut: The ‘Fading Ink’ effect. Start with a saturated blue and let it fade into a stark, textured white. This represents the Luni river disappearing into the Rann of Kutch.
Need Personalized Coaching?
Cracking the NID DAT requires more than just reading; it requires feedback from experts who have been there. If you’re struggling with visual spatial questions or ecological design, our mentors are available to help you for free.
💬 Chat with our Experts on WhatsApp (+91 9526806124)