Translate Language
Is India Really One of the World’s Most Equal Societies? The Truth Behind the Gini Index
A recent government report highlighted India as the “fourth most equal society” globally, citing the Gini Index. But how accurate is this claim? With exams like UPSC, NID, and NIFT often testing concepts of economic inequality, understanding the Gini Coefficient and its limitations is crucial for aspirants.

Understanding Inequality: The Gini Index Explained
What is the Gini Index?
The Gini Index (or Gini Coefficient) measures income or consumption inequality on a scale of 0 to 100:
0 = Perfect equality (everyone earns the same).
100 = Perfect inequality (one person holds all wealth).
India’s score of 25.5 places it among the most equal nations, but critics argue this data has gaps.
Why Did the Government Claim Inequality is Declining?
The World Bank’s Poverty and Equity Brief ranked India behind only Slovakia, Slovenia, and Belarus.
Welfare schemes like PM-KISAN and free food grains may have improved consumption equality.
However, wealth inequality (assets, property) remains high, which the Gini Index doesn’t fully capture.
Limitations of the Gini Index
Surveys vs. Reality: India tracks consumption, not income, which can underreport rich households.
Ignores Extreme Wealth: The top 1% holds 40% of national wealth, but the Gini Index focuses more on middle-class distribution.
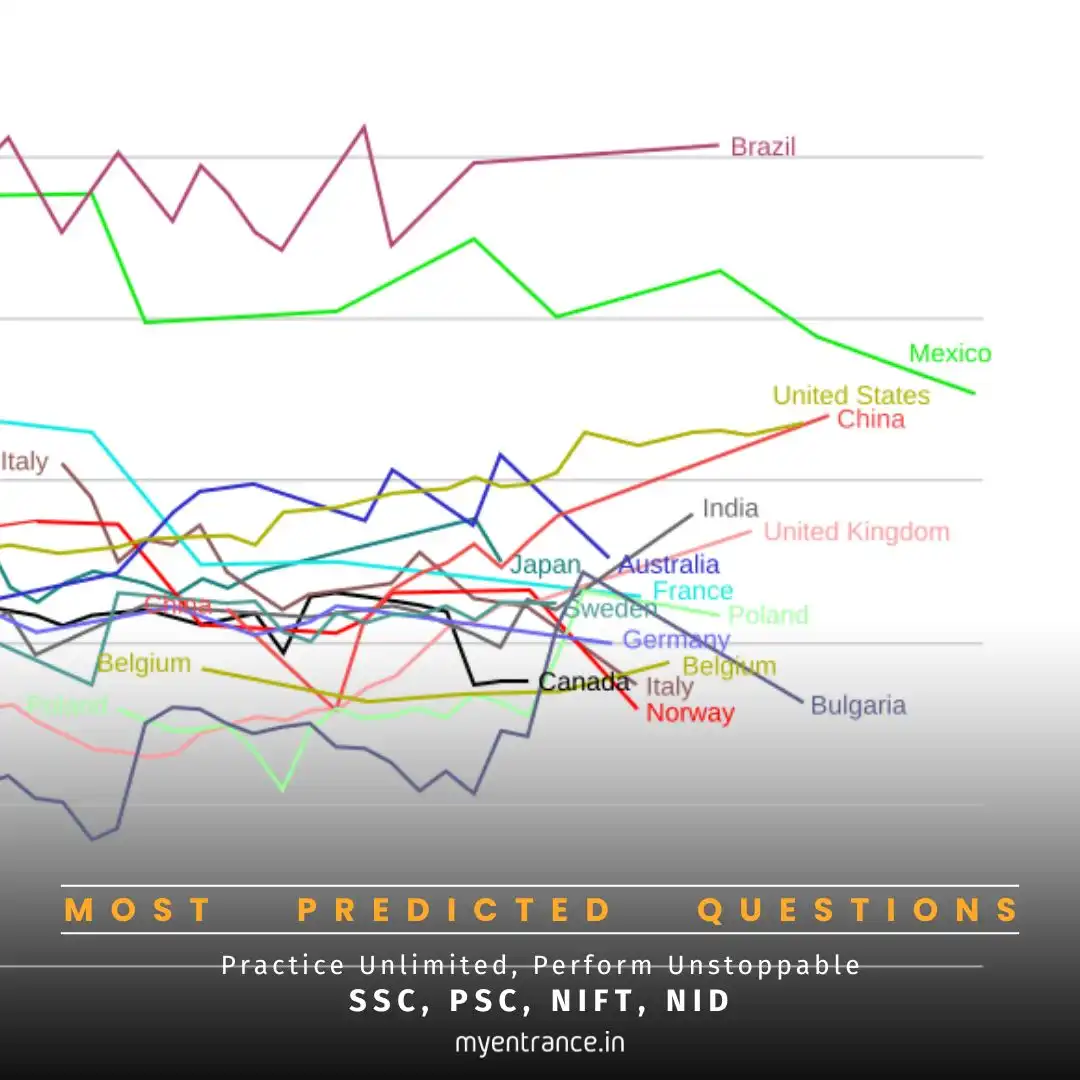
Global Comparisons: While India scores better than the US (41.8) or China (35.7), other reports (like the World Inequality Database) show rising inequality since 2004.
Why Fiscal Policy Matters
Taxes and welfare schemes aim to reduce inequality, but:
Direct Benefit Transfers (e.g., PM-KISAN) help poor farmers.
Regressive Taxes: Indirect taxes (GST) affect low-income groups more than the rich.
Sample Q&A for Competitive Exams
Q1: What does a Gini Index of 0 signify?
*A1: It indicates perfect equality, where every individual has identical income/consumption levels.*
Q2: Why might India’s Gini Index underestimate true inequality?
A2: It relies on consumption surveys (not income data) and overlooks wealth concentration in the top 1%.
Q3: Name two limitations of the Gini Coefficient.
*A3: (1) Insensitive to extreme wealth gaps, (2) Overemphasizes middle-class distribution.*
Q4: How does fiscal policy reduce inequality?
A4: Through progressive taxation, subsidies (e.g., food grains), and welfare schemes like MGNREGA.
Q5: Which database contradicts India’s declining inequality claim?
A5: The World Inequality Database shows rising Gini Index values from 2004–2023.
Why Is This Important for Exams?
UPSC: Covers “Inclusive Growth” in GS-III; inequality metrics are recurring themes.
NID/NIFT: Essay topics on socio-economic trends may reference inequality data.
Critical Thinking: Debating data limitations helps in answer-writing and interviews.
Key Takeaway: While India’s Gini Index suggests progress, wealth disparity and survey gaps mean the full picture is more complex. For aspirants, analyzing such reports builds analytical skills essential for competitive exams.
Get 3 Months Free Access for SSC, PSC, NIFT & NID
Boost your exam prep!
Use offer code WELCOME28 to get 3 months free subscription. Start preparing today!


